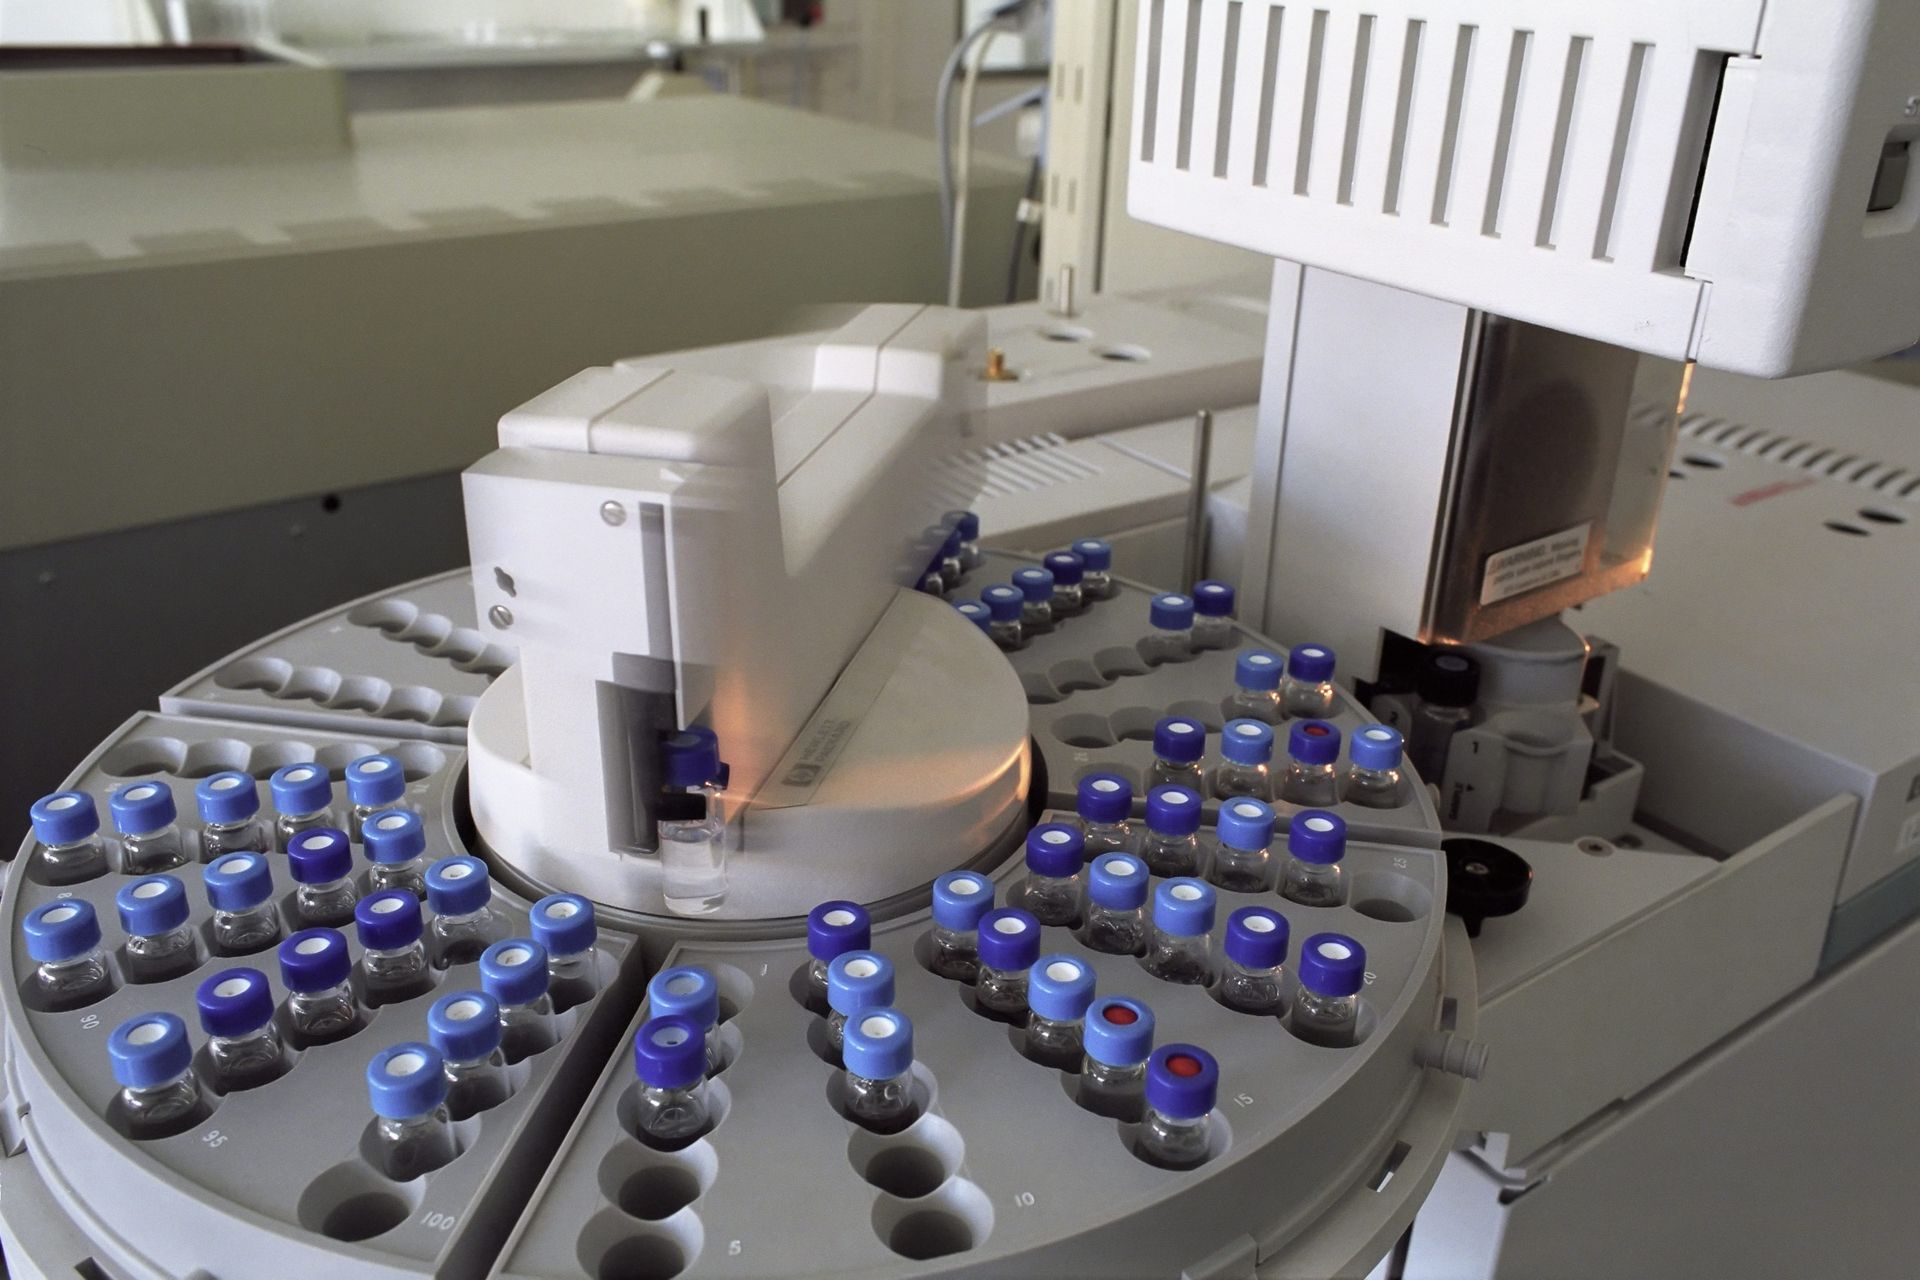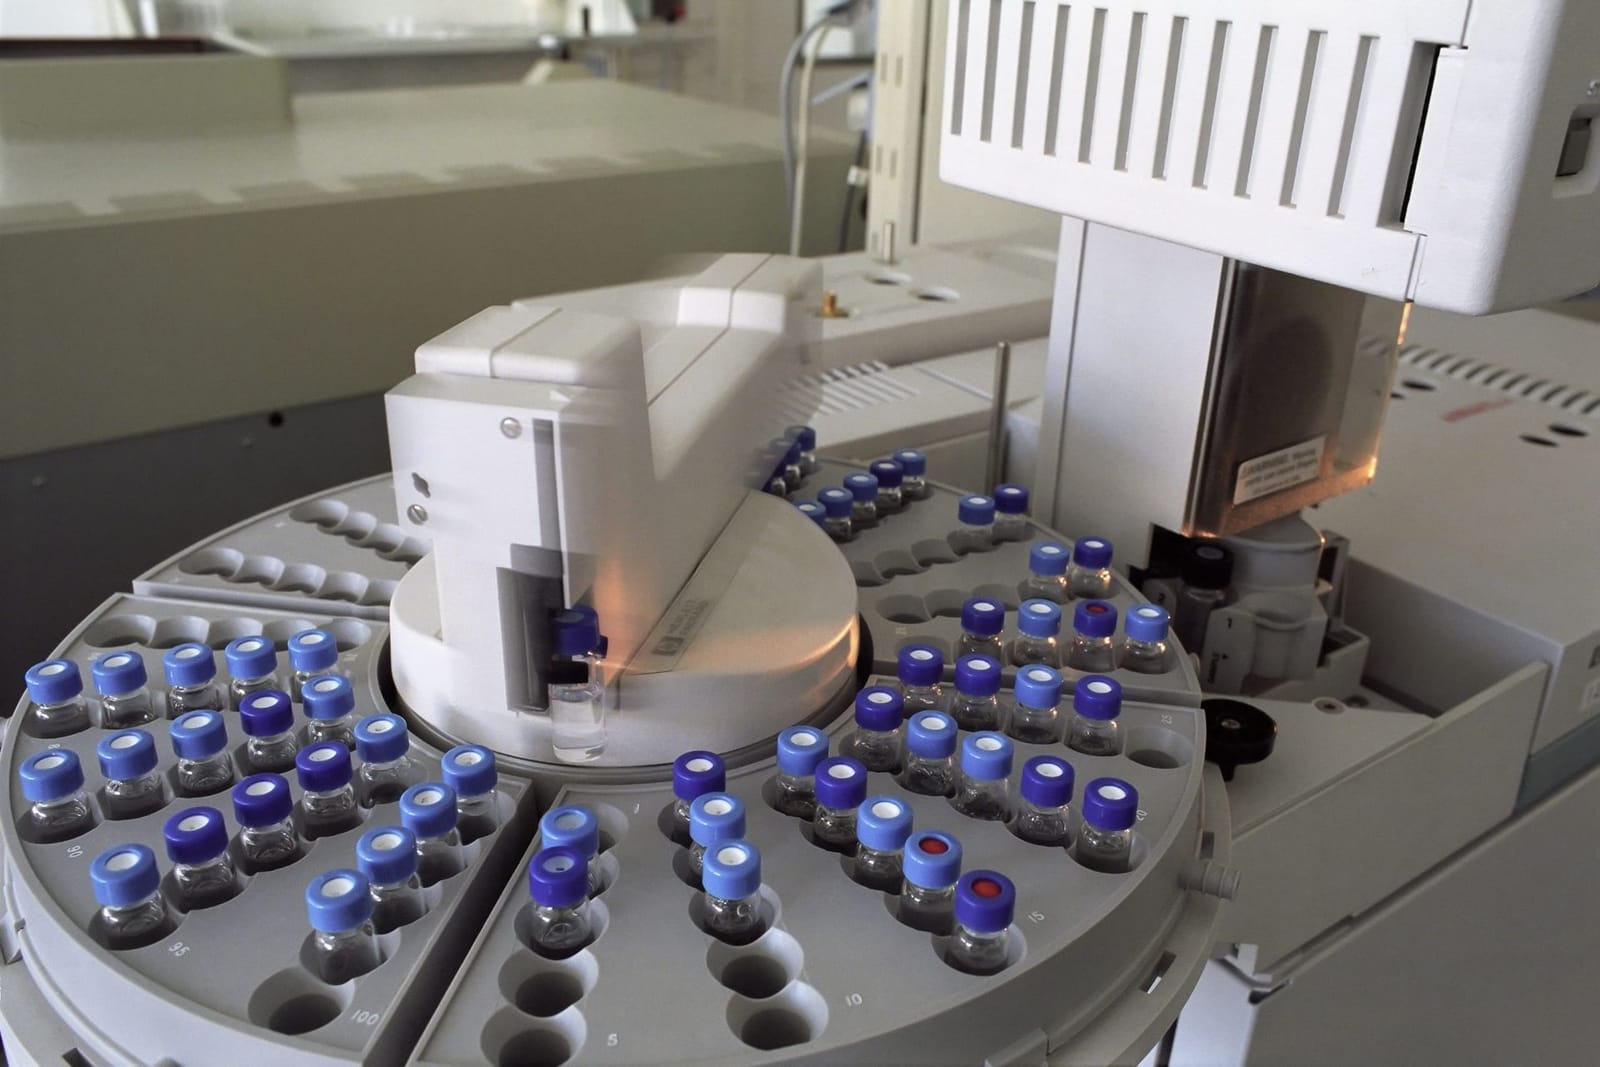
Peptide purity testing: how HPLC, mass spectrometry and amino acid analysis work together
How peptide purity is tested: RP-HPLC columns, TFA vs formic acid, 214 nm detection, LC-MS identity, net peptide content, amino acid analysis and ICH Q2(R2).
- Written by
- Kareem Ahmed BashaDirector & Chief Scientific Officer
- Reviewed by
- Nisar MohammedFounder & Managing Director
Published · Updated · 16 min read · 19 references
On this page
Short answer
Peptide purity is usually measured by reversed-phase HPLC with UV detection at 210–220 nm: the main peak's share of all detected peak area. Mass spectrometry confirms the peak is the right molecule, and amino acid analysis or nitrogen content shows how much of the powder is actually peptide. A purity figure alone answers only the first question.
Key facts
- HPLC purity is a relative number: the main peak as a percentage of the total peak area the method detects at its UV wavelength, usually 210–220 nm where the peptide bond absorbs.
- Most analytical peptide separations use silica-based C8 or C18 reversed-phase columns with water/acetonitrile gradients containing trifluoroacetic acid at about pH 2.
- TFA gives sharp peaks but suppresses the electrospray MS signal, so LC-MS work often trades some resolution for formic acid or other additives.
- Purity is not peptide content: water, counter-ion (TFA, acetate) and residual solvent also make up part of the powder's mass and are measured separately.
- EMA's synthetic peptide guideline recommends at least two orthogonal identity methods and orthogonal separation techniques to catch co-eluting impurities.
- Ph. Eur. general monograph 2034 sets reporting, identification and qualification thresholds of 0.1%, 0.5% and 1.0% for peptide-related impurities.
“Peptide purity” sounds like one number. In practice it is the answer to one specific question, asked by one specific method: what share of the peak area in a reversed-phase HPLC chromatogram belongs to the main peak? That number is useful, but it says nothing about whether the main peak is the right molecule, how much of the powder is peptide, or what is hiding underneath the peak.
This guide explains how peptide purity testing actually works: how the HPLC method is built, what mass spectrometry adds, how net peptide content differs from purity, which impurities a method must separate, and how methods are validated under ICH Q2(R2) and the harmonised pharmacopoeial chromatography chapters. For the specification and threshold side, see our guide to peptide API impurities and specifications.
What does peptide purity mean?
HPLC purity is a relative measurement. The chromatogram is integrated, every peak above the reporting threshold is summed, and the main peak is expressed as a percentage of that total. Because detection is by UV absorbance, usually at 210–220 nm where peptide bonds absorb strongly [1], the result is “area percent at that wavelength”, not a mass fraction.
Three consequences follow:
- Only what elutes and absorbs is counted. Water, salts and most residual solvents are invisible to the UV purity method. They lower the peptide content of the powder without changing the purity figure.
- Response factors differ. At 214 nm, tryptophan absorbs about 30 times more strongly than a peptide bond, and phenylalanine, tyrosine and histidine about six times more [4]. An impurity that lacks an aromatic residue can therefore be under-counted, and one that carries an extra aromatic residue over-counted.
- Co-eluting species are invisible. If an impurity elutes under the main peak, the purity figure includes it as product. EMA’s guideline singles out “the risk of co-eluting impurities” as a reason peptide methods need orthogonal checks [8].
How do you test peptide purity?
No single technique answers every question about a peptide sample. A complete characterisation combines several, each answering a different question.
| Technique | Question it answers | What it cannot tell you | Ref |
|---|---|---|---|
| RP-HPLC with UV (210–220 nm) | How much of the detected peptide-related material is the main peak (purity, related substances) | Identity of the peaks; water, salt and solvent content | [1] |
| LC-MS (ESI) | Molecular mass of the main peak and of individual impurities | Accurate quantity of each species without calibration | [3], [6] |
| MALDI-TOF MS | Molecular mass of the intact peptide, quickly | Separation of closely related species; quantification | [7] |
| LC-MS/MS or peptide mapping | Amino acid sequence; location of modifications | Purity percentage | [8] |
| Amino acid analysis | Amino acid composition; peptide content against weighed sample | Sequence order; most impurities | [14] |
| Size-exclusion LC | Dimers, oligomers, aggregates | Small related impurities | [8] |
| Ion chromatography or 19F NMR | Counter-ion (TFA, acetate, chloride) content | Peptide purity | [15] |
| Karl Fischer titration | Water content | Anything about the peptide itself | [18] |
| Chiral GC-MS or chiral LC | Enantiomeric (D/L) purity of each residue | Position of the wrong enantiomer | [8] |
EMA lists most of these as characterisation techniques for synthetic peptides: MS and LC-MS for molecular mass, LC-MS/MS of the intact molecule or of enzymatically digested material for sequence, NMR, Edman degradation, amino acid analysis for composition and chiral methods for enantiomeric purity [8]. For release testing, it recommends “at least two orthogonal methods” for identity [8].
How does RP-HPLC measure peptide purity?
Reversed-phase HPLC separates peptides by hydrophobicity. The sample is loaded onto a hydrophobic stationary phase in a mostly aqueous mobile phase, and an increasing proportion of organic solvent (almost always acetonitrile) elutes peptides “in order of increasing overall peptide hydrophobicity” [1]. RP-HPLC “remains the most widely used mode of HPLC for peptide separations” [1].
Typical analytical conditions, as described in the peptide chromatography literature:
| Parameter | Typical choice | Why | Ref |
|---|---|---|---|
| Stationary phase | Silica-based C8 or C18 | Favoured for “the vast majority of peptide separations” | [1] |
| Pore size | 80–100 Å packings, or wide-pore (300 Å) packings | Both appear in published peptide protocols; wide-pore particles are reviewed for larger peptides and proteins | [1], [5] |
| Mobile phase A | Water with acid additive, about pH 2 | Suppresses silanol interactions; ion-pairs basic residues | [1] |
| Mobile phase B | Acetonitrile with the same additive | Organic eluent | [1] |
| Additive | TFA, traditionally 0.05–0.1% | Sharp peaks, volatile, ion-pairing | [1], [15] |
| Gradient | Linear, generally 0.5–2.0% acetonitrile per minute | Steepness tunes resolution | [1] |
| Detection | UV at 210–220 nm (214 nm common) | Peptide bond absorbance | [1], [4] |
What is the best HPLC column for peptide analysis?
There is no universal best column, but there is a sensible default. Mant and colleagues describe silica-based packings with bonded octyl (C8) or octadecyl (C18) chains as the favoured supports for most peptide separations, and their own analytical work used 300 Å wide-pore columns alongside 80–100 Å packings [1]. Low pH protects against “undesirable ionic interactions” between positively charged residues and underivatised silanols, which become negatively charged above about pH 3–4 [1].
More recent options include wide-pore core-shell particles, fully porous sub-2 µm particles, monoliths and elevated column temperature, which Fekete and colleagues review in terms of both efficiency and selectivity for therapeutic peptides and proteins [5]. In practice, the “best” column is the one that resolves the critical pair: the impurity eluting closest to the main peak. That is also how ICH Q2(R2) suggests specificity is demonstrated for chromatographic methods [11].
TFA or formic acid?
TFA dominates peptide HPLC for good reasons. It is effective in separating complex peptide mixtures because of its ion-pairing properties, and because it is volatile it “eliminates the need for subsequent sample desalting” [1]. TFA, acetic, formic, phosphoric and hydrochloric acids at 0.1% (v/v) are the routine acidic additives, although that universal concentration “is not always optimal” [15]. Mant’s group found the optimum TFA concentration for peptide separations to be 0.2–0.25%, higher than the traditional 0.05–0.1% [1], and more hydrophobic perfluorinated acids such as heptafluorobutyric acid change selectivity further [2].
The problem is mass spectrometry. García’s review describes TFA as “a strong suppressor of the MS signal” in electrospray, and found that no single alternative additive generally replaced it: gains in MS sensitivity “strongly depended on the analyte” and “usually did not compensate for the loss in separation resolution related to TFA” [3]. Many laboratories therefore run a TFA method for UV purity and a formic acid method for LC-MS identity work.
Why 214 nm, and what that means for impurities
Peptide bonds absorb strongly in the far UV, so detection is “generally at 210–220 nm” [1]. Kuipers and Gruppen measured the peptide bond’s molar extinction coefficient at 214 nm as 923 M−1 cm−1 and showed that individual residues contribute very unevenly: tryptophan about 30 times the peptide bond, phenylalanine, tyrosine and histidine about six times, and proline about three times when inside the chain [4]. Area-percent purity assumes each impurity responds like the main peak. For truncated or modified sequences that assumption is approximately, not exactly, true.
HPLC vs mass spectrometry: what does each tell you?
HPLC quantifies; mass spectrometry identifies. Neither replaces the other.
| RP-HPLC (UV) | Mass spectrometry | |
|---|---|---|
| Measures | UV absorbance over time | Mass-to-charge ratio of ions |
| Main output | Purity (area %), related substances | Molecular mass; sequence (MS/MS) |
| Strength | Precise, robust quantification; pharmacopoeial system suitability | Specific identity; can identify unknown impurity peaks |
| Weakness | Cannot say what a peak is; misses co-elution | Ionisation varies by species, so it is weak for quantifying purity |
| Typical use on a COA | Purity and impurity results | Identity (“mass conforms”) |
ESI vs MALDI
Two ionisation techniques made peptide MS routine. Electrospray ionisation (ESI) produces intact ions from solution; Fenn and colleagues described its spectra as “coherent sequences of peaks whose component ions are multiply charged”, which is why an ESI spectrum of one peptide shows several peaks that must be deconvoluted to a single mass [6]. Because it works from solution, ESI couples directly to reversed-phase LC [3]. Matrix-assisted laser desorption ionisation (MALDI) was reported by Karas and Hillenkamp in 1988 for proteins with masses above 10,000 Da [7] and is widely used to confirm the mass of an intact peptide without a chromatographic step. Reversed-phase LC is compatible with both ESI and MALDI sources [5].
LC-MS for impurity identification
When an unknown peak appears above the identification threshold, LC-MS is the first tool for working out what it is. A mass difference of one residue points to a deletion or insertion; a difference matching a protecting group points to incomplete deprotection; a mass gain consistent with added oxygen points to oxidation. D’Hondt and colleagues catalogue these SPPS-related and degradation-related impurity classes in their review of peptide medicines [9].
Peptide mapping and MS/MS sequencing
Intact mass confirms composition, not order. Two peptides with the same residues in a different sequence have the same mass. Sequence is confirmed by tandem MS of the intact peptide or, for longer peptides where MS/MS data “may be difficult”, by peptide mapping: enzymatic cleavage followed by LC-MS of the fragments, as described in Ph. Eur. 2.2.55 [8].
Net peptide content vs purity: what is the difference?
This is the distinction most purity claims blur. Purity is relative to other peptide species. Net peptide content is relative to the whole powder.
A lyophilized peptide is not pure peptide. It contains:
- Water. EMA lists water content as a general property to describe for a peptide and expects it to be part of stability protocols for hygroscopic powders [8]. It is usually measured by Karl Fischer titration, which quantifies water through its reaction with iodine and sulphur dioxide [18].
- Counter-ion. Basic residues carry positive charges that must be balanced. Peptides purified with TFA “are obtained as trifluoroacetate salts” [15], and most marketed peptide drugs are acetate salts instead [15].
- Residual solvents from synthesis and purification.
A hypothetical example shows the arithmetic, not a real specification: a peptide with 98.5% HPLC purity, 7% water and 12% TFA counter-ion contains roughly 98.5 × (100 − 7 − 12) / 100 ≈ 80% of the target peptide by weight. Weigh the powder as if it were pure peptide and the real peptide concentration of every solution made from it is about 20% lower than calculated.
Peptide content is measured directly rather than by subtraction where possible. EMA lists LC against a reference standard, elemental analysis, amino acid analysis, nitrogen analysis by Kjeldahl and quantitative NMR as options for assay or content, and says LC assay limits “are expressed in terms of the counter-ion free, anhydrous substance, unless otherwise justified” [8].
Amino acid analysis
Amino acid analysis hydrolyses the peptide bonds, then separates, detects and quantifies the released amino acids [14]. The method dates to Moore and Stein’s work in the 1950s with hydrochloric acid hydrolysis, and “the basic methodology remains relatively unchanged” [14]. Against an accurately weighed sample, the molar amounts of stable residues give peptide content; their ratios confirm composition. Some residues need special handling: performic acid oxidation for methionine and cysteine and base hydrolysis for tryptophan [14]. Ph. Eur. 2.2.56 is the relevant general chapter [8].
Why counter-ions matter in research
TFA is not just dead weight. Cornish and colleagues found that TFA at 10−8 to 10−7 M reduced cell numbers in fetal rat osteoblast cultures, and that TFA salts of amylin and calcitonin consistently gave less proliferation than the hydrochloride salts, “resulting in failure to detect a proliferative effect or wrongly attributing an antiproliferative effect” [16]. That was an in vitro finding, but it is the reason many cell-based studies specify acetate or hydrochloride salts. Ion chromatography is described as “a technique of the first choice” for counter-ion determination, and TFA can also be measured by 19F NMR from its singlet at about −75 ppm [15].
What does “99% purity” mean, and what does it not mean?
A 99% HPLC purity result, honestly generated, means that 99% of the integrated peak area at the detection wavelength belongs to the main peak, under that method’s conditions. On its own it does not tell you:
- That the main peak is the right peptide. Only identity testing (MS, peptide mapping, amino acid analysis) shows that.
- How much peptide is in the vial. Water, counter-ion and solvent are not in the chromatogram.
- That nothing co-elutes. A diastereomer from racemisation can elute under the main peak. EMA notes that “control of diastereomers may require the development of specific methods” [8].
- That the method could see the impurities. A short, steep gradient can merge peaks and inflate purity.
- Anything about endotoxin, sterility or bioburden. Those are microbiological tests; see our guide to endotoxin testing for peptides.
The gap between a label claim and the material can be large. In a 2024 test-purchase study, researchers bought lyophilized semaglutide vials from illegal online pharmacies and analysed them by LC-MS. Documentation claimed “a purity of at least 99%”. No peptide-like impurities were identified, yet the measured semaglutide purity (semaglutide as a share of the powder mass) was 7.7% to 14.37%, and the authors reported endotoxin in all samples at levels they gave as 2.1645 to 8.9511 EU/mg, two of the three results being upper bounds [17]. The authors concluded that “research-grade 99% purity and pharmaceutical-grade product quality are distinctly different” [17]. That study had three vials, so its numbers describe those products, not a market average; the lesson about what a purity claim does and does not cover is general.
Which related substances does a peptide HPLC method need to separate?
Peptide-related impurities are mostly close relatives of the target sequence, which is what makes them hard to separate. D’Hondt and colleagues group them as SPPS-related and degradation-related [9]:
| Impurity type | Origin | How it is usually recognised | Ref |
|---|---|---|---|
| Deletion sequences | Inefficient Fmoc deprotection | LC-MS: mass lower by one residue | [9] |
| Insertion sequences | Excess amino acid reagent | LC-MS: mass higher by one residue | [9] |
| Diastereomers (racemised residues) | Racemisation during Fmoc deprotection | Same mass, so MS cannot flag them; may need specific or chiral methods | [8], [9] |
| Protecting-group adducts | Inefficient side-chain deprotection | LC-MS: mass gain matching the protecting group | [9] |
| Oxidation products | Oxidation of amino acid side chains | LC-MS: mass gain consistent with added oxygen | [9] |
| Dimers and oligomers | Dimeric-to-oligomeric impurities from synthesis or storage | SEC-LC or similar; EMA requires the species to be named | [8], [9] |
| Degradants (diketopiperazine, pyroglutamate, succinimide, β-elimination) | Peptide degradation mechanisms | Related-substances method, tracked on stability | [9] |
| Starting-material impurities | Enantiomeric and diastereomeric amino acid derivatives, dipeptides, β-alanyl species | Controlled in the protected amino acids before synthesis | [8] |
| Unrelated peptides | Contamination by other peptides | LC-MS; points to a lack of appropriate GMP | [9] |
How much of each is acceptable is a specification question. In the EU, Ph. Eur. general monograph 2034 sets thresholds for peptide-related impurities: reporting above 0.1%, identification above 0.5% and qualification above 1.0% [8]. EMA adds that a parameter named only “high molecular weight impurities” is “not acceptable” without naming the species [8]. Our impurities and specifications guide covers the EU and US thresholds in detail.
How should a peptide purity method be validated?
ICH Q2(R2), adopted on 1 November 2023, is the current framework for analytical procedure validation and covers “assay, potency, purity, impurity (quantitative or limit test), identity” methods [11]. For a peptide HPLC purity and impurity method, the characteristics that matter most are:
| Characteristic | What it means for a peptide method | Ref |
|---|---|---|
| Specificity/selectivity | Resolution of the closest-eluting pair, or agreement with an orthogonal procedure; spiking or stressing to show impurities are separated | [11] |
| Reportable range (impurities) | From the reporting threshold to 120% of the impurity acceptance criterion | [11] |
| Reportable range (purity as area %) | From 80% of the lower acceptance criterion up to the upper criterion or 100% | [11] |
| Quantitation limit | At or below the reporting threshold (0.1% under Ph. Eur. 2034) | [8], [11] |
| Accuracy and precision | Across the reportable range | [11] |
| Robustness | Evaluated during development under ICH Q14 | [11] |
Q2(R2) states that specificity “can be demonstrated through absence of interference or comparison of results to an orthogonal procedure”, and that “where one analytical procedure does not provide sufficient discrimination, a combination of two or more procedures is recommended” [11]. For peptides, EMA makes the same point more strongly: purity should be characterised “using an orthogonal approach, i.e. size-based, charge-based and hydrophobicity-based separation techniques”, with MS used from early development “to minimise the risk of co-elution” [8].
Which pharmacopoeial chapters apply to peptide purity testing?
Chromatography itself is now harmonised between the US, European and Japanese pharmacopoeias. USP <621> Chromatography in its harmonised form became official on 1 December 2022 [12], and the revised Ph. Eur. 2.2.46 Chromatographic separation techniques was implemented on 1 January 2023 [13].
| Chapter | Scope for peptide testing | Ref |
|---|---|---|
| USP <621> Chromatography | Definitions, system suitability (including new peak symmetry and system sensitivity requirements), allowed adjustments, reporting thresholds | [12], [19] |
| Ph. Eur. 2.2.46 Chromatographic separation techniques | Harmonised with USP <621>; supplements 2.2.29 Liquid chromatography and 2.2.30 Size-exclusion chromatography | [13] |
| Ph. Eur. 2.2.55 Peptide mapping | Sequence confirmation for longer peptides | [8] |
| Ph. Eur. 2.2.56 Amino acid analysis | Composition and content | [8] |
| Ph. Eur. 2.5.34 Acetic acid in synthetic peptides | Acetate counter-ion content | [8] |
| Ph. Eur. 2.2.64 Peptide identification by NMR | Identity | [8] |
| Ph. Eur. general monograph 2034 | Impurity thresholds for peptides (0.1 / 0.5 / 1.0%) | [8] |
Two harmonised changes are worth knowing when you read a chromatogram. The default symmetry factor range was extended from 0.8–1.5 to 0.8–1.8, and adjustments to a pharmacopoeial method’s column dimensions are now based on the length-to-particle-size (L/dp) ratio, with multiple adjustments triggering a risk assessment [13]. USP also replaced the term “disregard limit” with “reporting thresholds” [12], and has since proposed narrowing its new requirements: peak symmetry would apply only to assays and organic impurity or related substances tests, and system sensitivity only to impurity tests whose monograph states a reporting threshold [19]. Vergote and colleagues noted in 2009 that peptide monograph specifications themselves were “barely harmonized” between Ph. Eur. and USP, so the method chapters are more aligned than the individual monographs [10].
How to judge a peptide purity claim: a checklist
When you read a purity figure on a datasheet or certificate of analysis, check:
- Is there a chromatogram? A number without the trace cannot be judged. Look for baseline resolution around the main peak and an integration that includes small peaks.
- What wavelength and gradient? 210–220 nm is standard. A very steep gradient or a short run can hide impurities.
- Is identity confirmed separately? Expect an observed mass compared with the theoretical value, and for longer peptides, sequence data.
- Is net peptide content reported? If not, ask for it, or at least for water and counter-ion results.
- Which counter-ion? TFA, acetate or chloride, and how much.
- Is the batch number on the report the batch you received?
- Who ran the test, and is the laboratory accredited for it? See our COA guide for how to verify a report.
How Winhycare Pharma supplies research peptides
Winhycare Pharma supplies research peptides from Hyderabad, India, as research-use-only material, at purity of ≥99% as stated in our product brochure, and offers custom peptide synthesis for sequences outside the catalogue. Semaglutide, tirzepatide, retatrutide, cagrilintide and BPC-157 are also supplied as API to licensed manufacturers; see peptide APIs. Ask for the batch Certificate of Analysis and chromatogram with your quote, and tell us if your work needs a specific counter-ion or a net peptide content result: request research peptides.
For laboratory research use only. Not for human or veterinary use.
Frequently asked questions
How do you test peptide purity?+
The standard approach is reversed-phase HPLC with UV detection at 210–220 nm, reporting the main peak as a percentage of total peak area. Identity is confirmed by mass spectrometry, often LC-MS, and peptide content by amino acid analysis or nitrogen analysis. Water (Karl Fischer), counter-ion and residual solvent tests complete the picture.
What is the best HPLC column for peptide analysis?+
For most analytical work, a silica-based C18 or C8 reversed-phase column run with an acidic water/acetonitrile gradient. Wide-pore packings, often 300 Å, are widely used for larger peptides and proteins, and core-shell or sub-2 µm particles are newer options for higher efficiency. The best column is the one that resolves your peptide's critical impurity pair in a validated method.
What is the difference between HPLC and mass spectrometry for peptides?+
HPLC separates the peptide from its impurities and quantifies them by UV peak area, which gives the purity number. Mass spectrometry measures molecular mass and, with MS/MS, sequence, which confirms identity and helps identify impurities. HPLC cannot tell you what a peak is; MS on its own is a poor quantitative purity method.
Is net peptide content the same as purity?+
No. Purity is the main peptide as a share of the peptide-related material the HPLC method detects. Net peptide content is the share of the powder's total mass that is peptide. Water, counter-ions such as TFA or acetate, and residual solvents lower net peptide content but are invisible to a UV purity method.
What does 99% purity mean for a peptide?+
It means that, under that method's conditions, 99% of the detected peak area belongs to the main peak. It does not mean 99% of the powder by weight is peptide, that co-eluting impurities are absent, or that the main peak is the right molecule unless identity was also confirmed by mass spectrometry.
Why is TFA used in peptide HPLC?+
Trifluoroacetic acid keeps the mobile phase at about pH 2, which suppresses unwanted interactions with silica silanols, and acts as an ion-pairing reagent that sharpens peaks. It is also volatile, so collected fractions need no desalting. Its drawback is strong suppression of the electrospray MS signal.
What wavelength is used for peptide HPLC?+
Usually 210–220 nm, often 214 nm, because the peptide bond absorbs strongly in the far UV. Aromatic residues such as tryptophan absorb much more strongly than the peptide bond at 214 nm, so impurities missing or gaining an aromatic residue can be over- or under-estimated by area percentage.
What is amino acid analysis used for in peptide testing?+
Amino acid analysis hydrolyses the peptide into its amino acids, then separates and quantifies them. It confirms composition and, against a known sample weight, gives peptide content. EMA lists it both as an identity method and as one way to measure assay or content.
How are peptide HPLC methods validated?+
Under ICH Q2(R2), a quantitative impurity or purity method is validated for specificity, range, accuracy and precision, with a quantitation limit at or below the reporting threshold. Specificity for peptides is usually shown by resolving the closest-eluting impurity or by comparison with an orthogonal method.
Can a peptide be high purity and still fail?+
Yes. A peptide can show a single sharp HPLC peak and still carry a co-eluting diastereomer, a high endotoxin load, a large TFA counter-ion fraction or a high water content. Each of those needs its own test, which is why a full Certificate of Analysis lists several methods, not one number.
Sources
- Mant CT, Chen Y, Yan Z, et al. HPLC analysis and purification of peptides. Methods Mol Biol 2007;386:3-55, Methods in Molecular Biology (PMC open access)
- Shibue M, Mant CT, Hodges RS. Effect of anionic ion-pairing reagent hydrophobicity on selectivity of peptide separations by reversed-phase liquid chromatography. J Chromatogr A 2005;1080:68-75, Journal of Chromatography A
- García MC. The effect of the mobile phase additives on sensitivity in the analysis of peptides and proteins by HPLC-electrospray mass spectrometry. J Chromatogr B 2005;825:111-123, Journal of Chromatography B
- Kuipers BJH, Gruppen H. Prediction of molar extinction coefficients of proteins and peptides using UV absorption of the constituent amino acids at 214 nm. J Agric Food Chem 2007;55:5445-5451, Journal of Agricultural and Food Chemistry
- Fekete S, Veuthey JL, Guillarme D. New trends in reversed-phase liquid chromatographic separations of therapeutic peptides and proteins: theory and applications. J Pharm Biomed Anal 2012;69:9-27, Journal of Pharmaceutical and Biomedical Analysis
- Fenn JB, Mann M, Meng CK, Wong SF, Whitehouse CM. Electrospray ionization for mass spectrometry of large biomolecules. Science 1989;246:64-71, Science
- Karas M, Hillenkamp F. Laser desorption ionization of proteins with molecular masses exceeding 10,000 daltons. Anal Chem 1988;60:2299-2301, Analytical Chemistry
- Guideline on the Development and Manufacture of Synthetic Peptides, EMA/CHMP/CVMP/QWP/367182/2025 (in effect 1 June 2026), European Medicines Agency
- D'Hondt M, Bracke N, Taevernier L, et al. Related impurities in peptide medicines. J Pharm Biomed Anal 2014;101:2-30, Journal of Pharmaceutical and Biomedical Analysis
- Vergote V, Burvenich C, Van de Wiele C, De Spiegeleer B. Quality specifications for peptide drugs: a regulatory-pharmaceutical approach. J Pept Sci 2009;15:697-710, Journal of Peptide Science
- ICH Q2(R2) Validation of Analytical Procedures, final version adopted 1 November 2023, International Council for Harmonisation
- <621> Chromatography: Notice of Adoption of Harmonized Standard (official 1 December 2022), United States Pharmacopeia
- General chapter 2.2.46. Chromatographic separation techniques now published in Ph. Eur. 11th Edition (27 July 2022), EDQM, Council of Europe
- Rutherfurd SM, Gilani GS. Amino acid analysis. Curr Protoc Protein Sci 2009;Chapter 11:Unit 11.9, Current Protocols in Protein Science
- Sikora K, Jaśkiewicz M, Neubauer D, Migoń D, Kamysz W. The role of counter-ions in peptides: an overview. Pharmaceuticals 2020;13:442, Pharmaceuticals (MDPI, open access)
- Cornish J, Callon KE, Lin CQ, et al. Trifluoroacetate, a contaminant in purified proteins, inhibits proliferation of osteoblasts and chondrocytes. Am J Physiol 1999;277:E779-E783, American Journal of Physiology
- Ashraf AR, Mackey TK, Vida RG, et al. Multifactor quality and safety analysis of semaglutide products sold by online sellers without a prescription. J Med Internet Res 2024;26:e65440, Journal of Medical Internet Research (open access)
- Tavčar E, Turk E, Kreft S. Simple modification of Karl-Fischer titration method for determination of water content in colored samples. J Anal Methods Chem 2012;2012:379724, Journal of Analytical Methods in Chemistry (open access)
- <621> Chromatography, proposed revision of the System Sensitivity and Peak Symmetry subsections (USP-NF, based on the official text of 1 December 2024), United States Pharmacopeia
About the author
Kareem Ahmed Basha
Director & Chief Scientific Officer, Winhycare Pharma
Kareem Ahmed Basha is a director and the chief scientific officer of Winhycare Pharma in Hyderabad, India, and writes and reviews the division’s technical content on peptides, peptide APIs and lyophilisation.
He has nearly two decades of pharmaceutical quality experience, including 11 years 8 months at Dr. Reddy’s Laboratories in India and Mexico and earlier roles at Biocon and Anthem Biosciences.
- Pharmaceutical quality assurance (cGMP, GLP)
- Vendor qualification and CMO audits
- Deviations, CAPA and change control
- Data integrity and LIMS
- Technology transfer
- Peptide APIs
- Peptide lyophilisation
Reviewed by Nisar Mohammed, Founder & Managing Director, on .